Every day around 14:00 the Dutch government institution RIVM publishes data about new confirmed cases of, and deaths due to, COVID-19. At the time of writing (March 28th, in the afternoon) there are 9762 confirmed cases, 2954 people have been/are hospitalized, and 639 people have died until now. There is no data about people who have recovered. The testing regime in the Netherlands is very limited, only severely ill patients and some health care workers are tested. I understand about 2500 tests are done every day, last day 1159 of the tests were positive. I think the number of confirmed cases is basically meaningless.
I have been sick for the last week with COVID-19-like symptoms: fever, short of breath, throat ache, … Luckily it was mild and I’m feeling much better at the moment. Two Dutch people I follow on Twitter also have COVID-19. I have not seen the two others and they have not seen each other, so these are three independent cases. I follow about 200 people. I guess about half of them is Dutch and a person (not a company or so). This means 3% of the people is ill. With 17 million people in the Netherlands, this means 510 thousand people. The people I follow on Twitter is not a representative sample of the Dutch population. On the other hand, the families of the people I follow are also sick. Does that compensate each other?
I have no background in medicine or epidemiology, but I am a scientist and like to think about these kind of problems. Is there a more scientific way to estimate the number of infected people?
It seems that the “best” way to estimate the number is to use the Case Fatality Rate (CFR), the number people deceased divided by the number of people diagnosed (i.e. confirmed cases). The CFR turns out to be a tricky number. See for more details also Our World in Data.
First is because it assumes both the number of deaths and number of diagnosed to be accurate. The number of deaths is probably the most accurate information we have. The number of confirmed cases is however unknown — that is the whole problem. Apparently it is usually measured after the fact by testing for antibodies in a sample of the population. The best we can do is look for countries with widespread testing and look at their CFR.
Second is that the CFR is clearly different per age group and health status. COVID-19 is especially lethal for older people. Since Italy has an older population than China, the CFR in Italy will probably be higher than in China. If we want to compare countries, we should look at nearby countries with a similar population-structure.
Third is that the CFR is not constant. At the beginning of the outbreak the doctors in China didn’t know what was going on and had to come up with a treatment, the number of deaths (and the CFR) were probably relatively high. As time progressed, doctors became more experienced and the CFR dropped. In Italy the doctors could use the experience of the Chinese, hopefully reducing the CFR. However, as the Italian health care system became overwhelmed by the number of seriously ill people, the CFR is likely to increase.
The biggest problem for an estimate is however that there is a delay between when the disease starts (or is confirmed) and death. This delay seems to be about two weeks. People dying today (March 28th) have contracted the disease around March 14th. Using the CFR we can only say something about the situation two weeks ago.

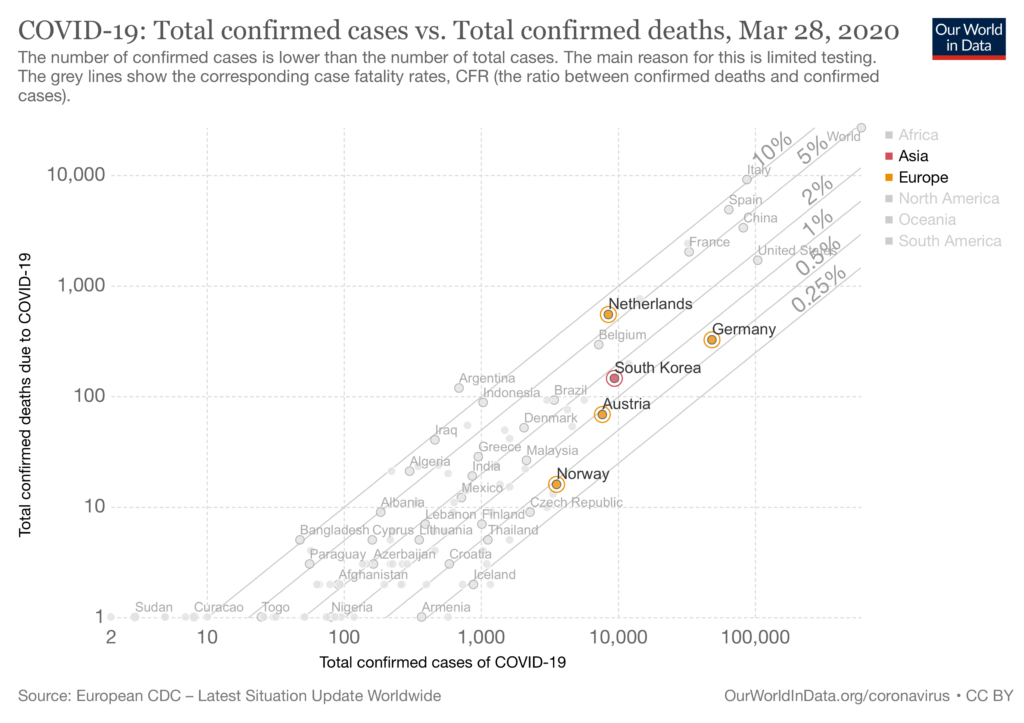
Still, despite all the caveats, let’s try to use the CFR to estimate the actual number of cases in the Netherlands. The figure above, from Our World in Data, plots the number of confirmed cases versus the number of confirmed deaths. You can see that the CFR in the Netherlands is much higher compared to South Korea, Germany, Austria, and Norway. South Korea seems to be testing a lot, but the population may not be comparable to that of the Netherlands. The population of the other countries are more comparable to the Netherlands. Their lower CFR indicates that they do a lot more testing. If more tests are done, more cases would be confirmed and the marker will shift to the right, towards a lower CFR.
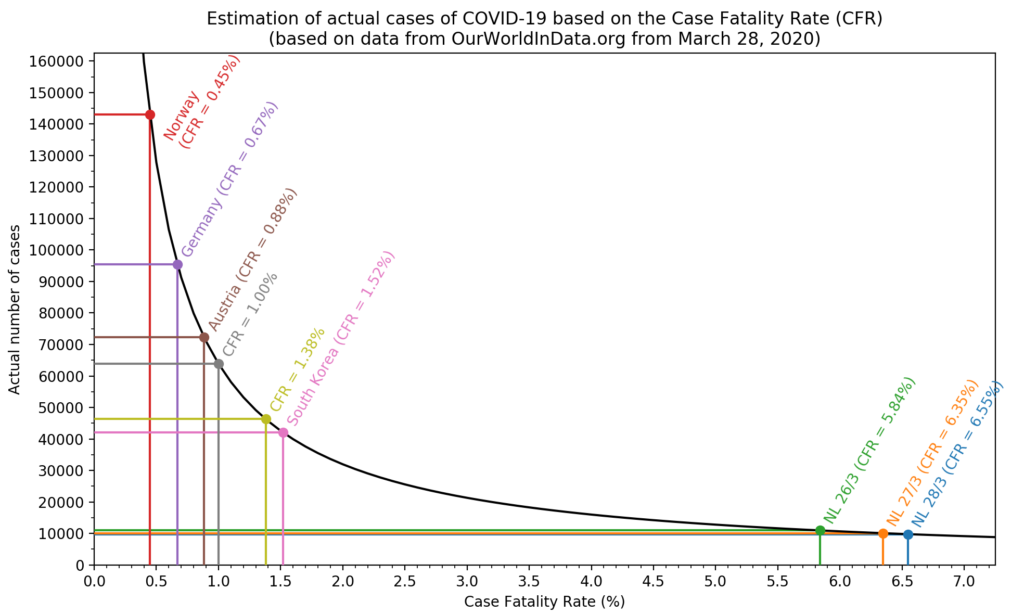
In the figure below the number of cases are estimated for different CFRs. If the CFR is between 0.45% and 0.88%, then we had, two weeks ago, between 72 and 143 thousand cases in the Netherlands.

On this website they try to estimate the percentage of cases that are actually reported, by using the delay. However, they use a CFR of 1.38%, which seems quite high. The delay between when a case was reported and death was fixed to 13 days. I can believe that there is a delay of 13 days between the start of the disease and death, but people (especially in the Netherlands) are tested relatively late and 13 days seems too long, or at least, too rigid.
With all the limitations, I think we can estimate that two weeks ago between 70 and 140 thousand people in the Netherlands had COVID-19. This is between 0.4% and 0.8% of the Dutch population.
The growth in the last two weeks is very difficult to estimate, especially because two weeks ago bars etc have been closed and everyone has been instructed to keep 1.5 m distance. Still, I wouldn’t be surprised if the number of infected people is three to four times higher now. [1] That means between 210 and 560 thousand people in the Netherlands are, or have been, infected with COVID-19. My Twitter-based estimate may not have been so wrong after at all.
[1]: Why three to four times higher? If 100 people are infected and they each infect 2 other people (R0=2), then they infect 200 people, for a total of 300 people (=3x more) [2]. They will in turn infect more people, but maybe not as many because of the partial lockdown. (back)
[2] Of course, if R0=2, then 33.3 people infected 66.6 new people, to make 100 total. The 66.6 newly infected people will infect 133 other people, making a total of 243. It is a bit slower, but given all the uncertainties in this calculation… (back)